Overview
2024 Ocean Health Index Scores!
Tue, Dec 03, 2024
This year marked the largest decline in global Ocean Health Index scores we have observed over 13 years of assessments.
The global Ocean Health Index (OHI, for short) measures how well we are managing the marine resources we depend upon and enjoy. We measure 10 benefits, or goals, that people want and need from the ocean for 220 coastal countries and territories.
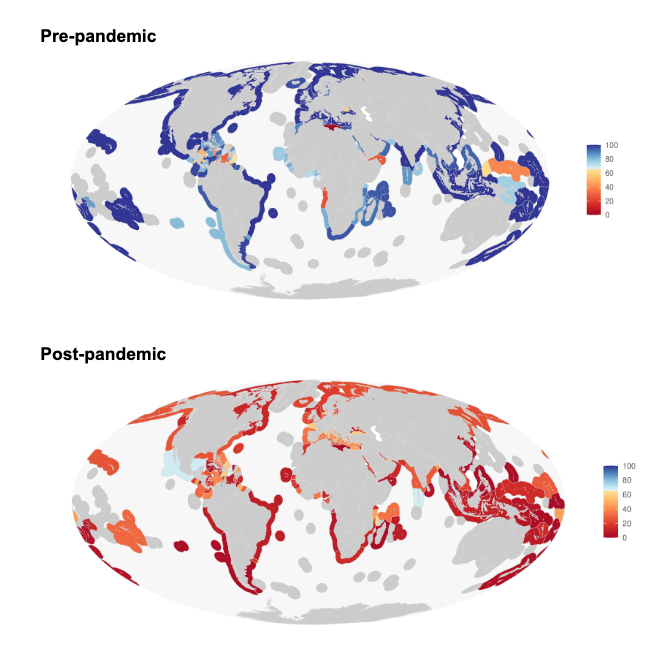
This year, the overall global OHI score was 69, which was a 5 point drop from last year’s score of 74. Not surprisingly, the low scores were driven by the collapse of tourism and recreation during the COVID-19 pandemic, which caused the global tourism and recreation score to drop from 92 to 18. Tourism and recreation has since rebounded in most places, but the data we use to calculate these scores lags the Index by two years so, thus far, we are unable to measure the recovery.
Figure 1. Tourism and recreation scores. Global tourism and recreation scores dropped from 92 to 18 in 2021 after the start of the COVID pandemic. All countries were impacted.

Is the 30x30 movement losing momentum?
The sense of place goal measures how well we are preserving the marine systems that we value as part of our cultural identity. The lasting special places component of this goal measures how well we are protecting the places we value, with the objective of protecting 30% of coastal area based on the 30x30 initiative. The global score for lasting special places increased from 54.0 to 62.4 from 2012 to 2021. However, from 2021 to 2024 the score has remained at 62.0, indicating that global marine protected areas have actually declined a small amount.
This trend is observed in the British Indian Ocean Territory, which previously received a score of 100, indicating 30% of coastal areas were protected, but the 2024 score was 0 after the Chagos Marine Protected Area in Mauritius was removed. The decline for this region may be short-lived because efforts to create a new MPA under Mauritius governance are underway. Other regions that may have removed protected areas include: Malaysia, Gibraltar, Sint Maarten, Tuvalu, Bahamas, Azores, Sint Eustasius, Oecussi Andeno, New Caledonia, Mozambique, Curacao, Haiti, and Monaco.
Although the 30x30 initiative may be losing momentum, new protected areas are being established in Oman, Sweden, Ascension, and Ireland, and 73 regions have scores of 100.
Is interest in mariculture slowing down?
Farmed seafood will be an important source of food in the future given the inability of fisheries to meet increasing demand for seafood as well as the relatively low ecological pressures associated with mariculture. Although mariculture scores are always low, we have seen evidence of growing interest in sustainable aquaculture. Several countries, including Germany, Ecuador, and Portugal, have dramatically increased their mariculture scores over time, and global mariculture scores increased by about 3% each year from 2021 to 2023. However, this trend seems to be slipping given this year’s increase of only 1%, and declining mariculture scores in several countries, including Japan, Thailand, Sweden and Italy. This may reflect the challenges of establishing marine aquaculture systems during the pandemic or it may reflect limits to our interest and ability to establish and maintain aquaculture farms. It will be interesting to watch this trend in the future to see what is driving this change.
Marine habitats and animals continue to face challenges
The past 13 years of assessments have documented consistent declines in the scores for the habitat, biodiversity, and iconic species subgoals. These goals monitor the condition of habitats and species, and decreasing scores indicate that marine habitats and animals are facing continuing threats to their well-being and existence. Of particular concern is the decline in scores for iconic species, which measures the condition of animals we value for spiritual and cultural reasons. We have observed an average global decline of a half a point per year, and scores have declined for 187 of the 220 regions we measure. This pattern is widespread, but the regions of most concern are located in the Southern Pacific Islands.
Other patterns
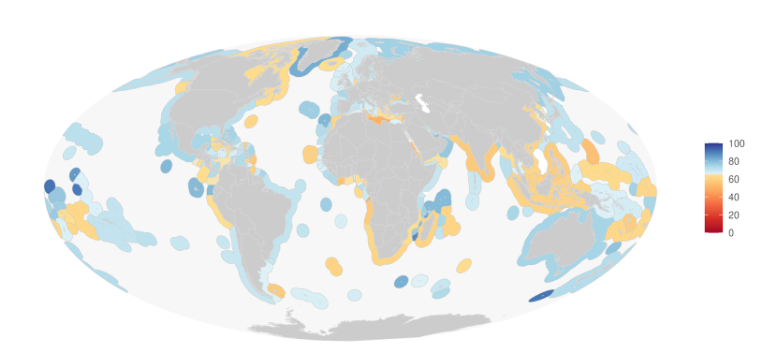
As we have observed in other years, the regions with the overall highest scores tend to be uninhabited, or sparsely populated, islands, although several larger countries have fairly high scores, including United Arab Emirates, Qatar, Russia, New Zealand, and Portugal (Figure 2). Regions with the low scores include Southern Africa and Southeast Asia.
Figure 2. 2024 Ocean Health Index scores for 220 regions.

We may be witnessing declines in the fisheries scores for countries along the Baltic Sea, e.g., Poland and Lithuania, but we cannot say for certain without better data. The data used to calculate this subgoal catch data have not been updated since 2019.This data gap also affects our confidence in the natural product scores, which uses the same data to estimate the sustainability of fish oil and fish meal products.
The pathogen component of the clean waters goal has continued to improve, with regions in South America, as well as the Marshall Islands, Kiribati, Nauru and Maldives having improved access to sanitation systems.
###Learn more You can learn more about the OHI Index and explore all the goal scores on our website!
As usual, the 2024 assessment includes a new year of data, calculated using the most recent data available from agencies and other sources. Given our commitment to using the best available science, we also updated previous years’ scores (2012-2023) using the latest science and data when available. The data and code underlying these results are publicly available (Data preparation and Score calculation).