Overview
The Global Ocean Health Index Celebrates its 10th Birthday!
Tue, Dec 07, 2021
We are proud to announce our 10th (!) year of measuring the state of the world’s oceans.
The global Ocean Health Index (OHI, for short) measures how well we are managing the sustainable delivery of 10 benefits, or goals, that people want and need from the ocean. We invite you to visit the new Ocean Health Index website (which, if you are reading this, you are already on) to explore country and goal scores, see how scores are calculated, and learn more about conducting your own Ocean Health Index assessment!
We invite you to visit the new Ocean Health Index website (which, if you are reading this, you are already on) to explore country and goal scores, see how scores are calculated, and learn more about conducting your own Ocean Health Index assessment!
As usual, the 2021 assessment includes a new year of data, calculated using the most recent data available from agencies and other sources. Given our commitment to using the best available science, we also updated previous years’ scores (2012-2021) using the latest science and data when available. As always, the data and code underlying these results are publicly available (Data preparation and Score calculation).
This year’s assessment was led by Gage Clawson, Melanie Frazier, and Ben Halpern. Robyn Thiessen-Bock and Thomas Thelen led website design and development.
Overview of Results
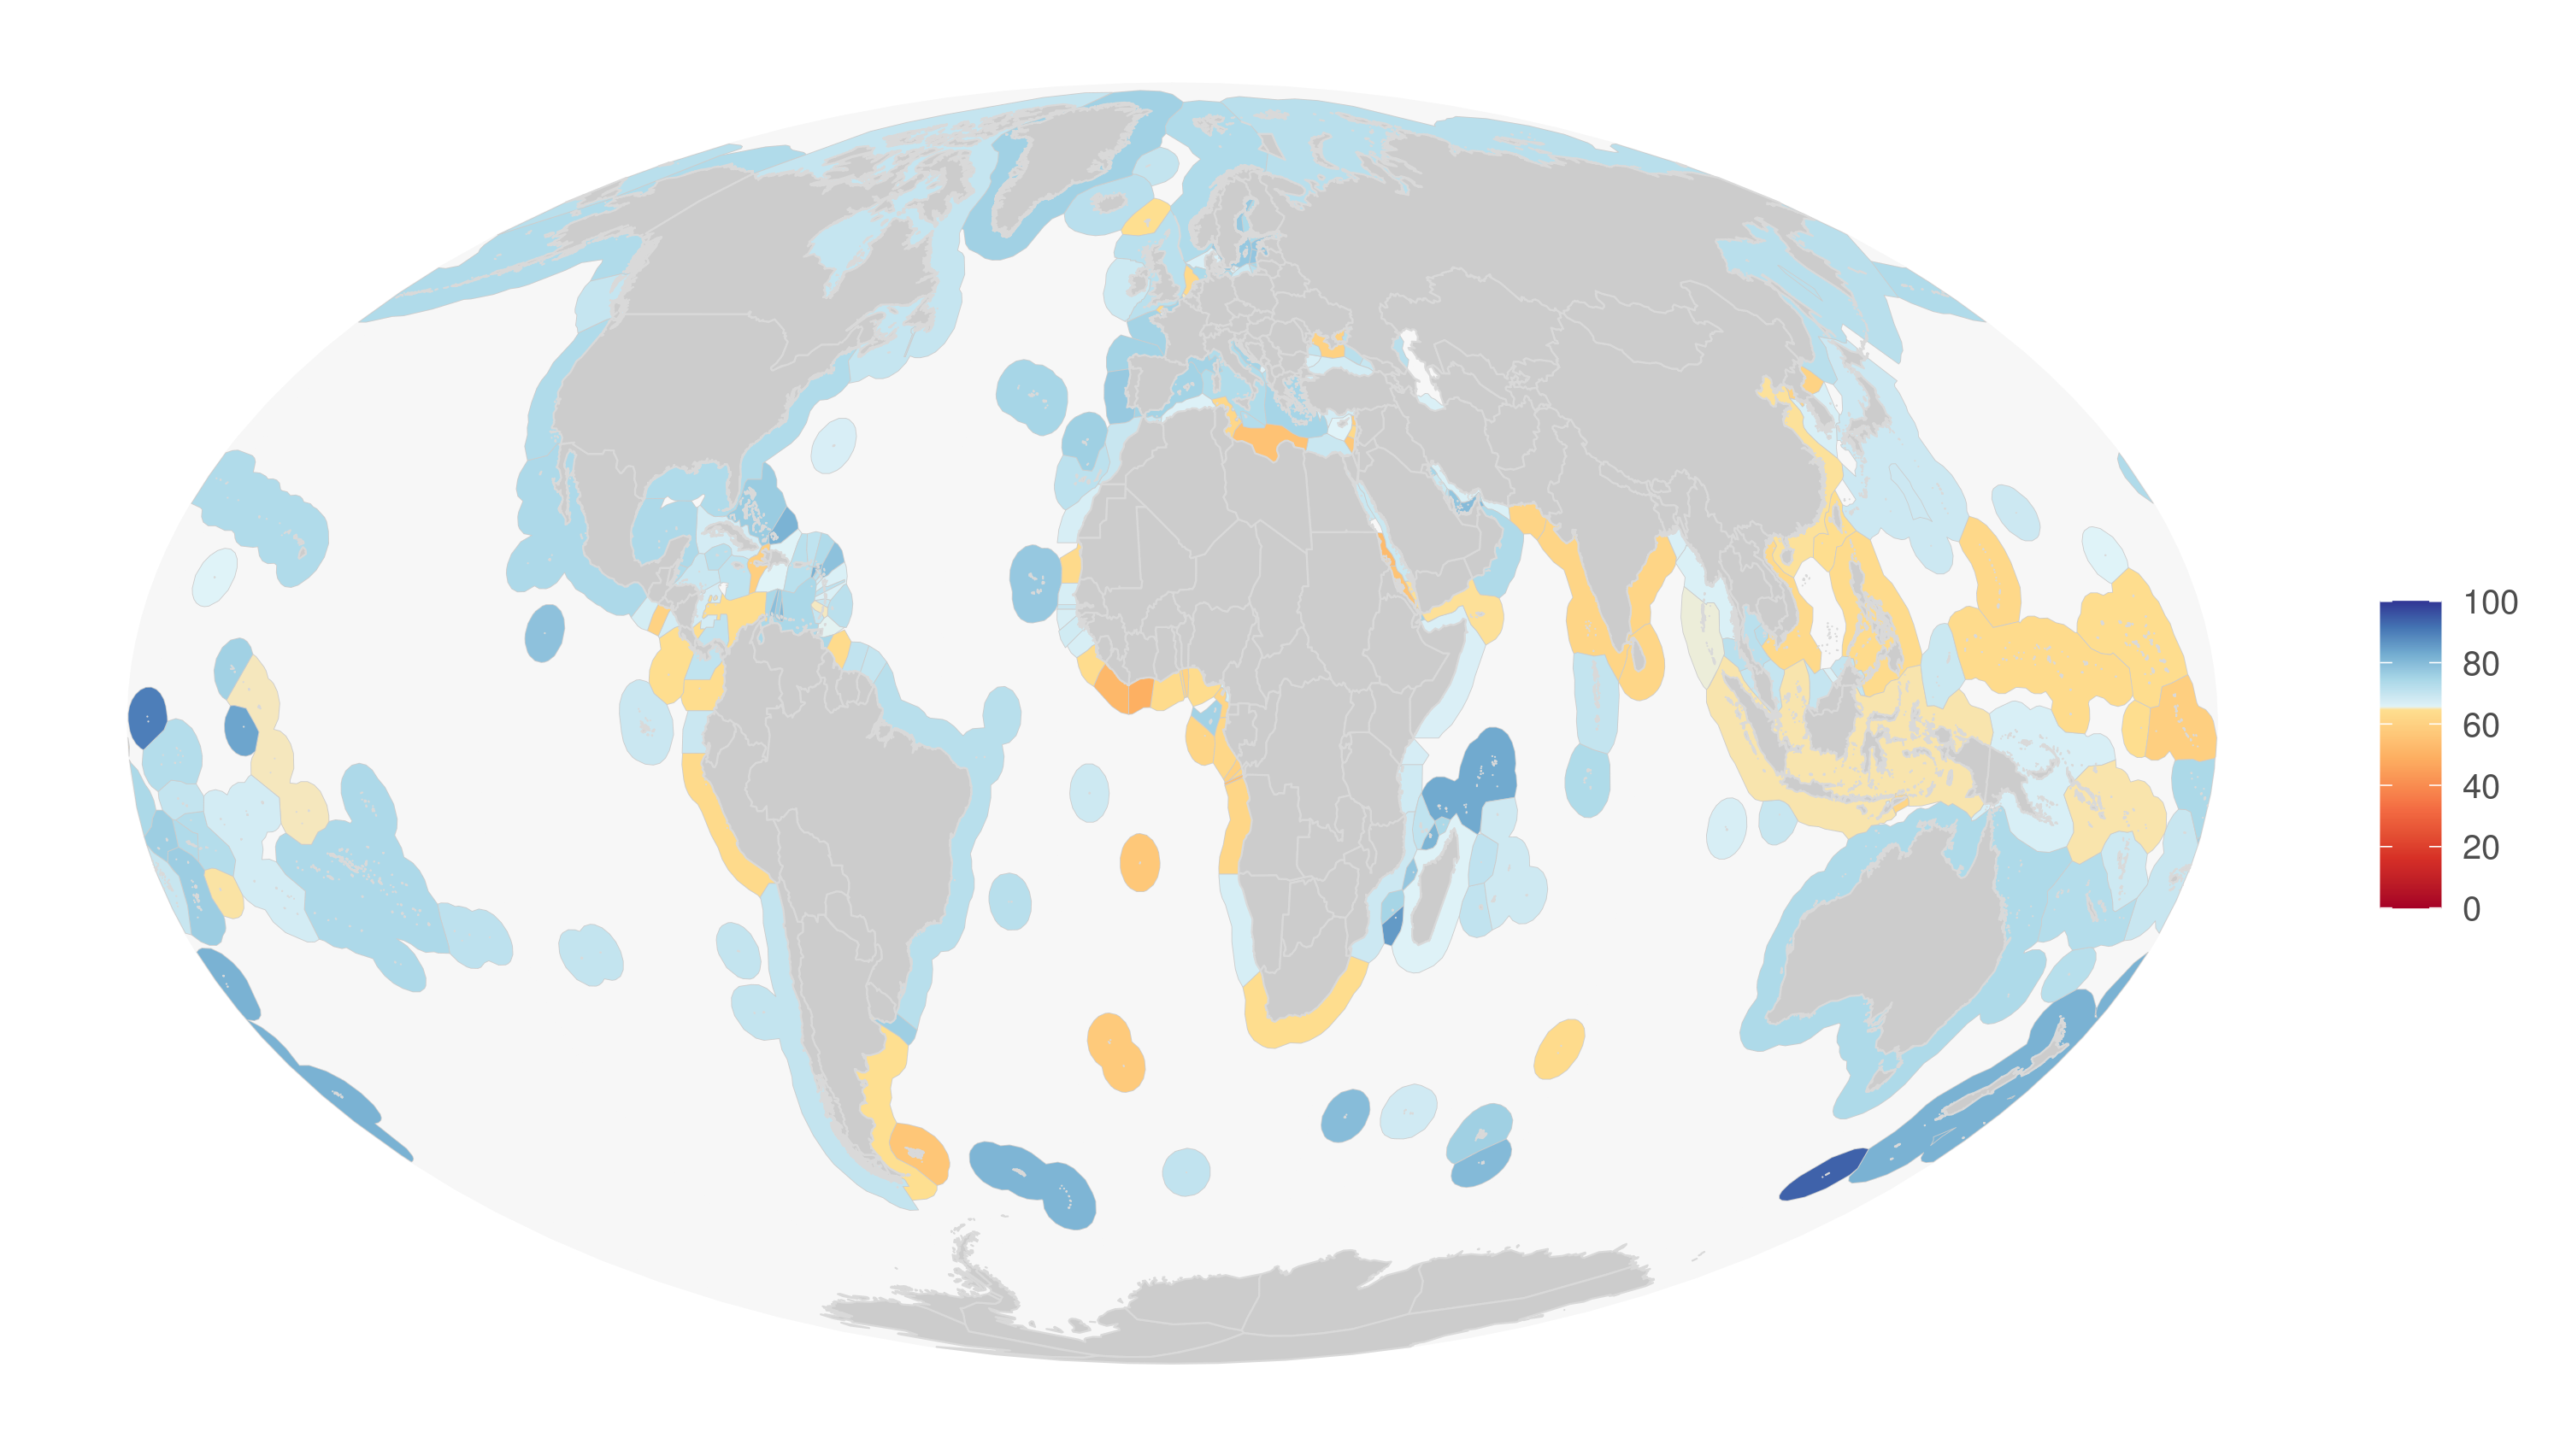
The overall global index score was 70 (Figure 1), which is similar to previous years. The regions with the highest scores tend to be uninhabited, or low human population, islands, although Portugal, Sweden, and the United Arab Emirates also have relatively high scores (Figure 2). Regions with low scores tend to be in Africa, Latin America and the Caribbean, and Asia.
Figure 1. Flower plot describing the average 2021 global Ocean Health scores (eez area weighted average of region scores) for the overall Index (center value) and goals/subgoals (petals).
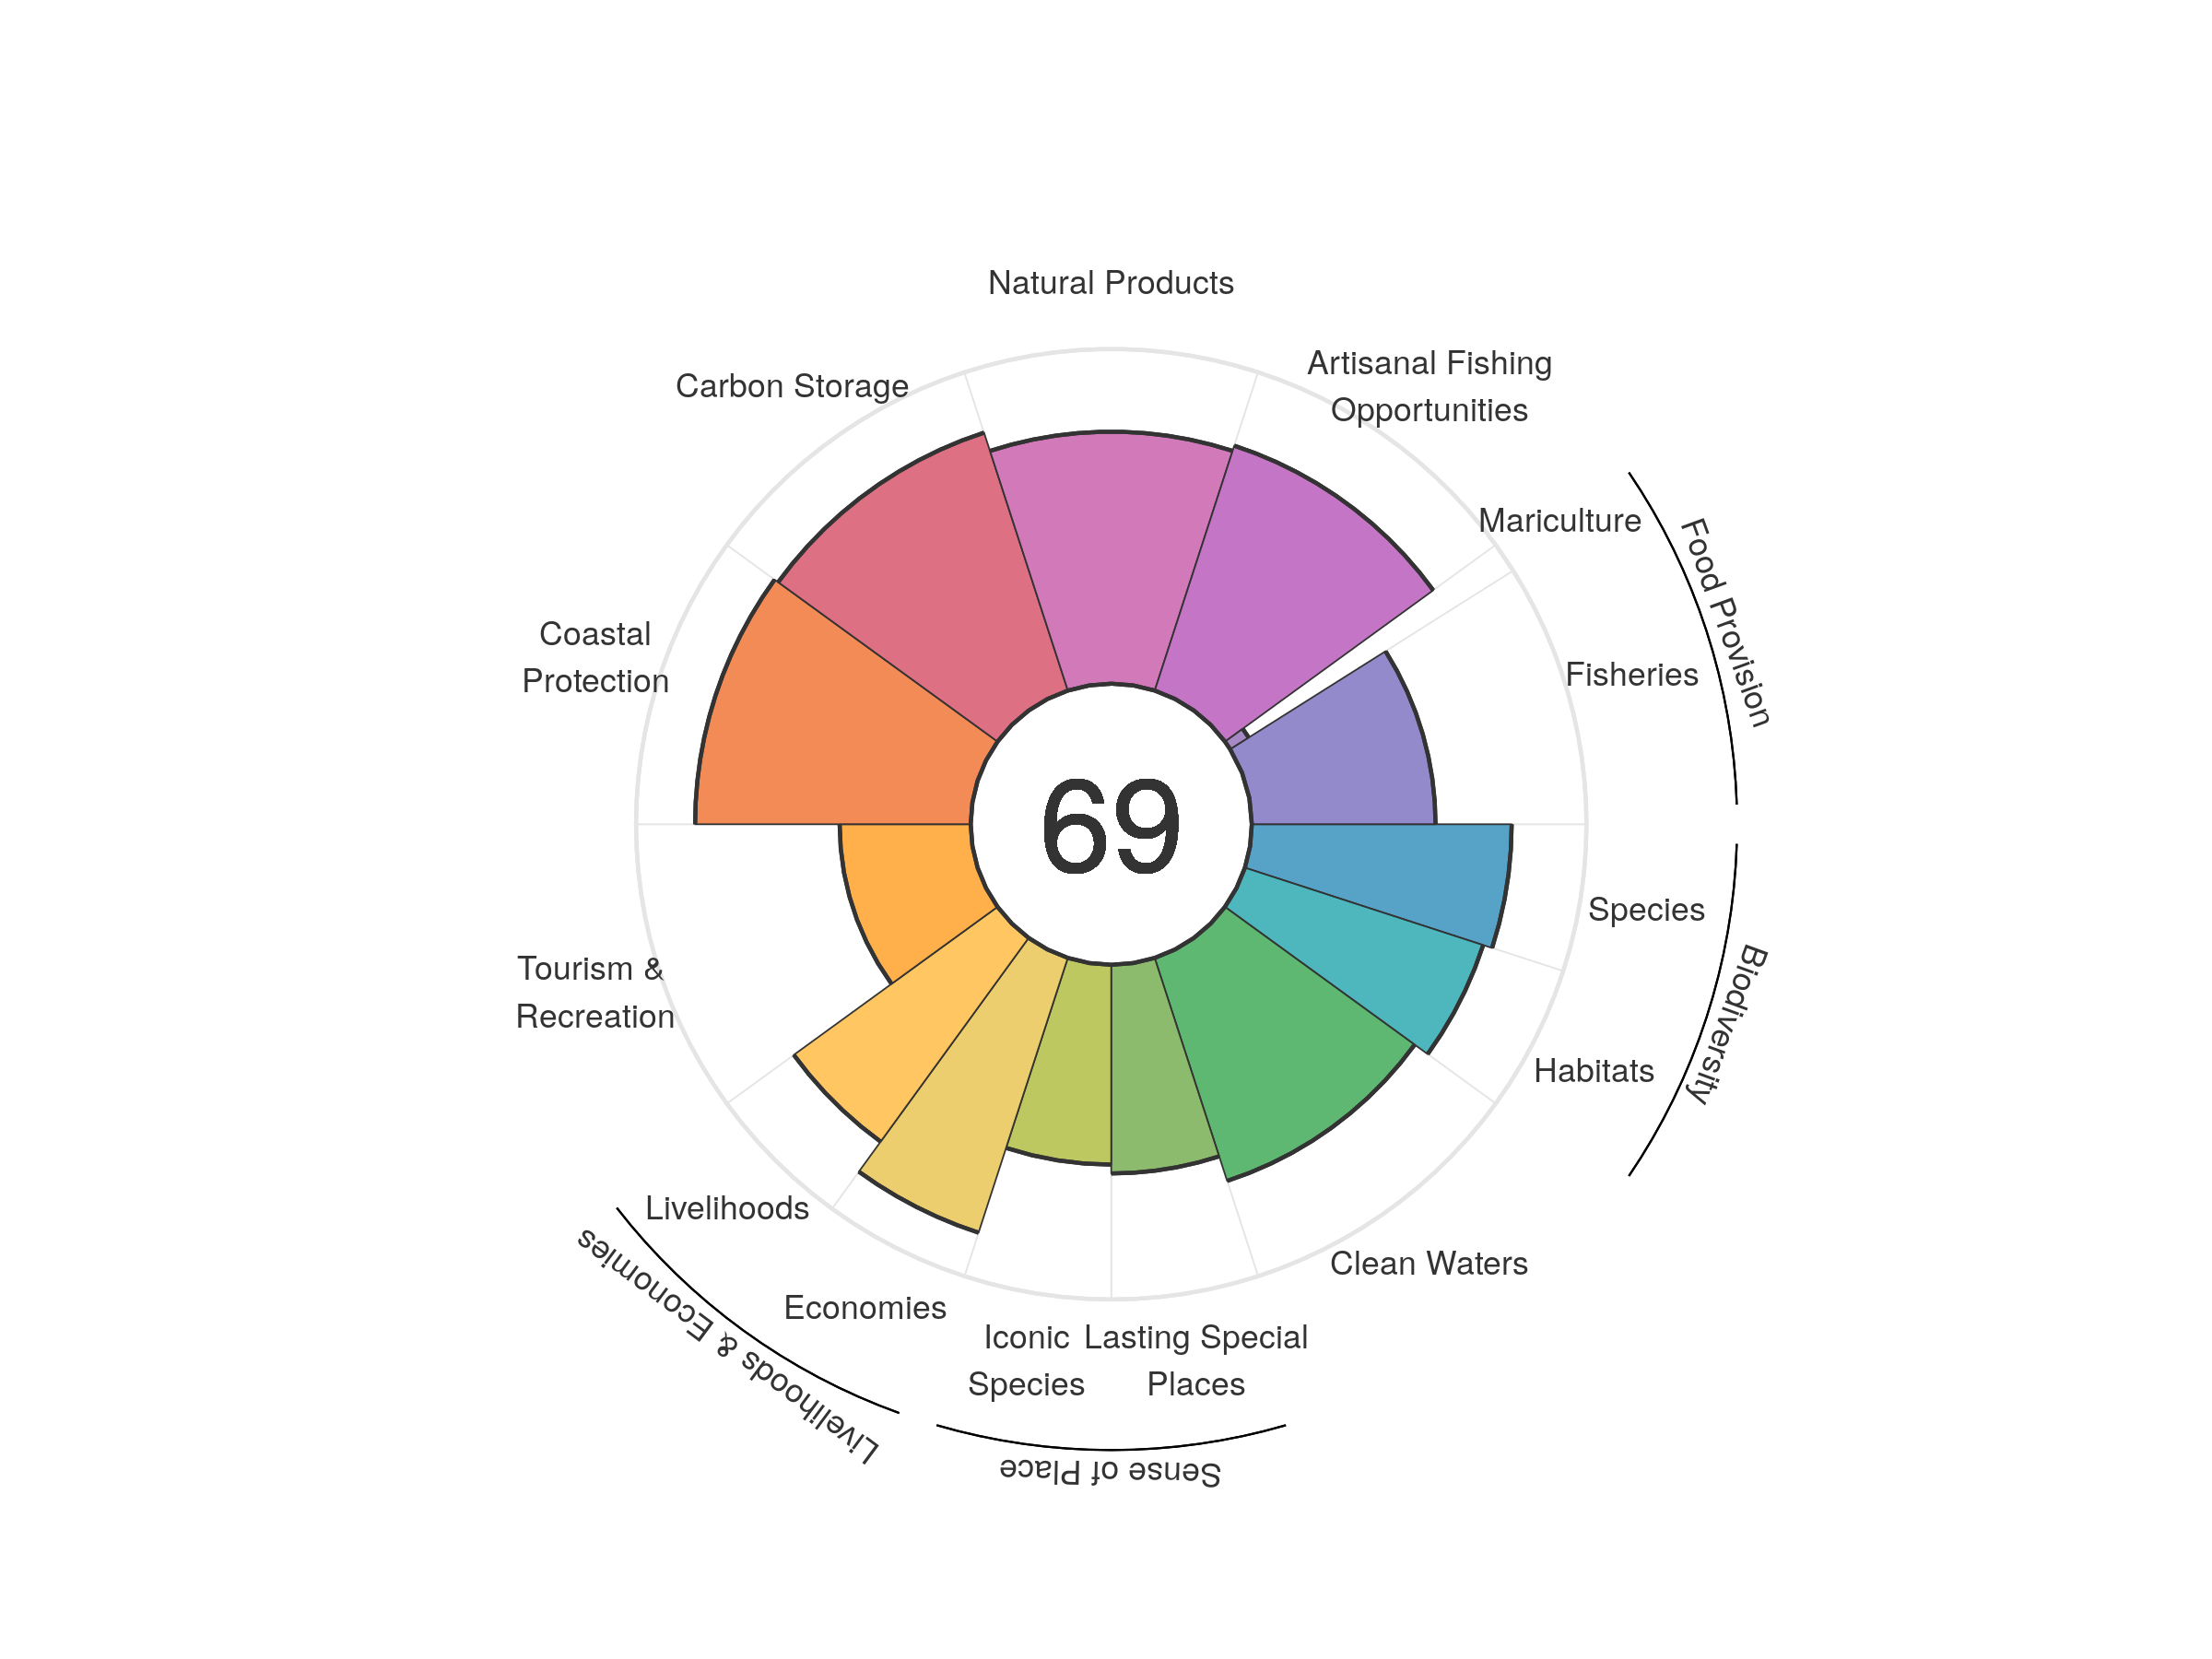
Figure 2. 2021 Ocean Health Index scores for 220 regions.
Although overall index scores have hovered around 70 since 2012, a deeper dive into the index reveals some interesting trends and patterns.
Scores for many regions are reasonably good, and global scores have overall increased since 2012 for some goals, such as: tourism and recreation (although we were unable to incorporate the consequences of Covid because these data are not yet available), sense of place, and clean waters. However, we observed some worrisome patterns for fisheries, iconic species, and species condition, all of which had the lowest reported scores since the start of the Index in 2012 (Table 1).
Table 1. Ocean Health Index, global scores (eez area weighted average of region scores) for the Index and goals/subgoals for all years.
| goal | 2012 | 2013 | 2014 | 2015 | 2016 | 2017 | 2018 | 2019 | 2020 | 2021 | 2022 | 2023 | 2024 | |
|---|---|---|---|---|---|---|---|---|---|---|---|---|---|---|
| 1 | Index | 71.5 | 72.2 | 72.9 | 73.4 | 73.5 | 73.5 | 73.7 | 73.8 | 73.9 | 73.7 | 73.9 | 69 | 68.8 |
| 2 | Artisanal opportunities | 75 | 75.5 | 75.5 | 75.4 | 74.9 | 74.5 | 74.5 | 74.2 | 74.9 | 74.5 | 76.4 | 76.8 | 76.9 |
| 3 | Species condition (subgoal) | 79.9 | 79.9 | 79.7 | 79.4 | 79.2 | 78.9 | 78.7 | 78.5 | 78.2 | 78 | 77.7 | 77.5 | 77.2 |
| 4 | Biodiversity | 78.6 | 78.1 | 78.3 | 78.4 | 77.9 | 77.4 | 77.2 | 76.8 | 76.4 | 76.4 | 76.3 | 76.3 | 76.1 |
| 5 | Habitat (subgoal) | 77.4 | 76.3 | 76.8 | 77.4 | 76.6 | 75.9 | 75.8 | 75.2 | 74.7 | 74.8 | 74.9 | 75 | 74.9 |
| 6 | Coastal protection | 80.1 | 80.1 | 82.6 | 82.6 | 82.4 | 82.1 | 82 | 81.7 | 81.7 | 81.9 | 82.3 | 82.8 | 83 |
| 7 | Carbon storage | 81 | 81 | 81 | 81 | 81 | 81 | 81.1 | 81.1 | 81.1 | 81.1 | 81.1 | 81.1 | 81.1 |
| 8 | Clean water | 69.2 | 69 | 69.5 | 69.6 | 69.6 | 69.9 | 70.2 | 70.8 | 71 | 71.2 | 71.1 | 71.3 | 71.3 |
| 9 | Fisheries (subgoal) | 54.5 | 54.9 | 54.8 | 54.6 | 54.2 | 54 | 53.5 | 53.9 | 54.1 | 54.5 | 55.1 | 55 | 54.9 |
| 10 | Food provision | 50.7 | 51.1 | 51.1 | 50.7 | 50.4 | 50.1 | 49.5 | 49.7 | 49.6 | 49.7 | 50.1 | 50.1 | 50.1 |
| 11 | Mariculture (subgoal) | 5.7 | 5.7 | 5.7 | 5.7 | 5.8 | 5.9 | 6 | 6.1 | 6.2 | 6.4 | 6.6 | 6.8 | 6.9 |
| 12 | Iconic species (subgoal) | 66 | 66 | 66.8 | 66.9 | 67.6 | 67 | 67 | 67.7 | 65.3 | 63.3 | 62.9 | 62.8 | 62.8 |
| 13 | Sense of place | 60.4 | 61.1 | 61.4 | 61.9 | 62.4 | 62.6 | 63.5 | 64.4 | 63.6 | 62.8 | 62.6 | 62.4 | 62.4 |
| 14 | Lasting special places (subgoal) | 54.9 | 56.1 | 55.9 | 56.9 | 57.1 | 58.3 | 60.1 | 61.1 | 61.9 | 62.4 | 62.2 | 62 | 62 |
| 15 | Natural products | 75.2 | 75.7 | 76.5 | 76.7 | 76.6 | 76.3 | 75.8 | 74.1 | 74.3 | 72.8 | 73.4 | 73.7 | 74.3 |
| 16 | Tourism & recreation | 69 | 72.4 | 75.1 | 80.9 | 84.2 | 86.7 | 88.6 | 91.5 | 92.1 | 92.8 | 92.3 | 22.4 | 18.4 |
MORE RESULTS
Below we take a deeper dive into some of the interesting patterns we observed in the data for specific goals and regions.
Food provisioning
One of the most fundamental services the ocean provides is the provision of food. Fish provide nearly 20% of global animal protein, helping to meet the basic nutritional needs of over half of the world’s population (FAO 2020)!
Given the importance of marine fisheries as a source of food, the apparent decline in scores is potentially alarming. Over the past 10 years, there has been a slight increase (~1%) in fish catch (2009/2010 vs. 2017/2018). However, the differences in catch are drastically different across regions, ranging from 200% more to 1% less, which can produce many different outcomes for fish stocks depending on the status of the stock (underfished, fully exploited, overfished). 120 of the 220 regions included in OHI have a fisheries score less than 50. Small island nations tend to have high scores, and Macquarie Island is the highest scoring region for the fisheries subgoal in 2021.
Marine aquaculture also provides large quantities of food; however, this is an underutilized resource with only a handful of countries reaching their potential. Countries that appear to be reaching (likely the low end of) their sustainable potential include: Germany, Finland, Denmark, South Korea, Netherlands, and Spain. And several countries have had marked increases in recent production, including: Germany, Ecuador, Malta and Turkey. This goal will be interesting to watch in coming years as mariculture production continues to increase, and the sustainability of mariculture practices become better understood.
Sense of place
People derive a sense of identity or value from living near the ocean, visiting coastal or marine locations or just knowing that such places and their characteristic species exist.
One way we attempt to capture this goal is through the lasting special places subgoal which measures how well we are protecting marine resources by establishing Marine Protected Areas, MPAs. A perfect score indicates a region is protecting 30% of the inland area and 30% of the marine offshore area. This reference point was established given the Global Ocean Alliance’s call to protect 30% of the ocean by 2030 (e.g., https://www.oceanunite.org/30-x-30/)
Exciting news: The global score for the lasting special places subgoal has steadily improved from 2012 to 2021 because many countries have established coastal and marine protected areas. In fact, one of the most common ways countries have improved their Index scores is through the establishment of protected areas. Currently, 71 of the 220 coastal countries and territories protect at least 30% of their coastal areas. This has been a substantial improvement since 2012, when we started the Index, when 51 coastal countries and territories had met this goal. This demonstrates the remarkable effectiveness of programs encouraging conservation.
Clean waters
Clean water in marine environments is valued for aesthetic, health, and environmental reasons. The clean waters goal measures contamination due to chemicals, excess nutrients, trash, and pathogens.
Overall, scores for the clean waters goal have increased modestly since 2012. The reason for the improvement depends on the region, but it is often driven by improved sanitation throughout the world that results in fewer pathogens in waterways. For many countries there has also been a decrease in land-based nitrogen input associated with manure and fertilizer application. The past 10 years have witnessed about a 5% increase in synthetic fertilizer use (2010/2011 vs. 2018/2019), however, this varies dramatically by country. Some of the countries with the largest coastlines and most fertilizer use have actually decreased their synthetic fertilizer use. For example, mainland China which uses nearly 30% of global fertilizer has decreased its fertilizer use by 8% in the past 10 years. The United States has decreased its fertilizer use by 2.3% over the same period, which actually results in a fairly substantial decrease in global fertilizer use because the US accounts for about 11% of global fertilizer consumption. Germany has decreased their fertilizer use by an impressive 21% during the same period. Of the 166 countries reported by FAO, 55 of them have decreased their fertilizer use from 2010-2019.