Overview
2023 Ocean Health Index Scores!
Sun, Dec 03, 2023
We are proud to announce our 12th year of measuring the state of the world’s oceans.
The global Ocean Health Index (OHI, for short) measures how well we are managing the sustainable delivery of 10 benefits, or goals, that people want and need from the ocean.
As usual, the 2023 assessment includes a new year of data, calculated using the most recent data available from agencies and other sources. Given our commitment to using the best available science, we also updated previous years’ scores (2012-2023) using the latest science and data when available. The data and code underlying these results are publicly available (Data preparation and Score calculation).
This year’s assessment was led by the OHI fellows Erika Egg, Carlo Broderick, and Adelaide Robinson, and supported by NCEAS scientists Gage Clawson, Melanie Frazier, and Ben Halpern.
Overview of Results
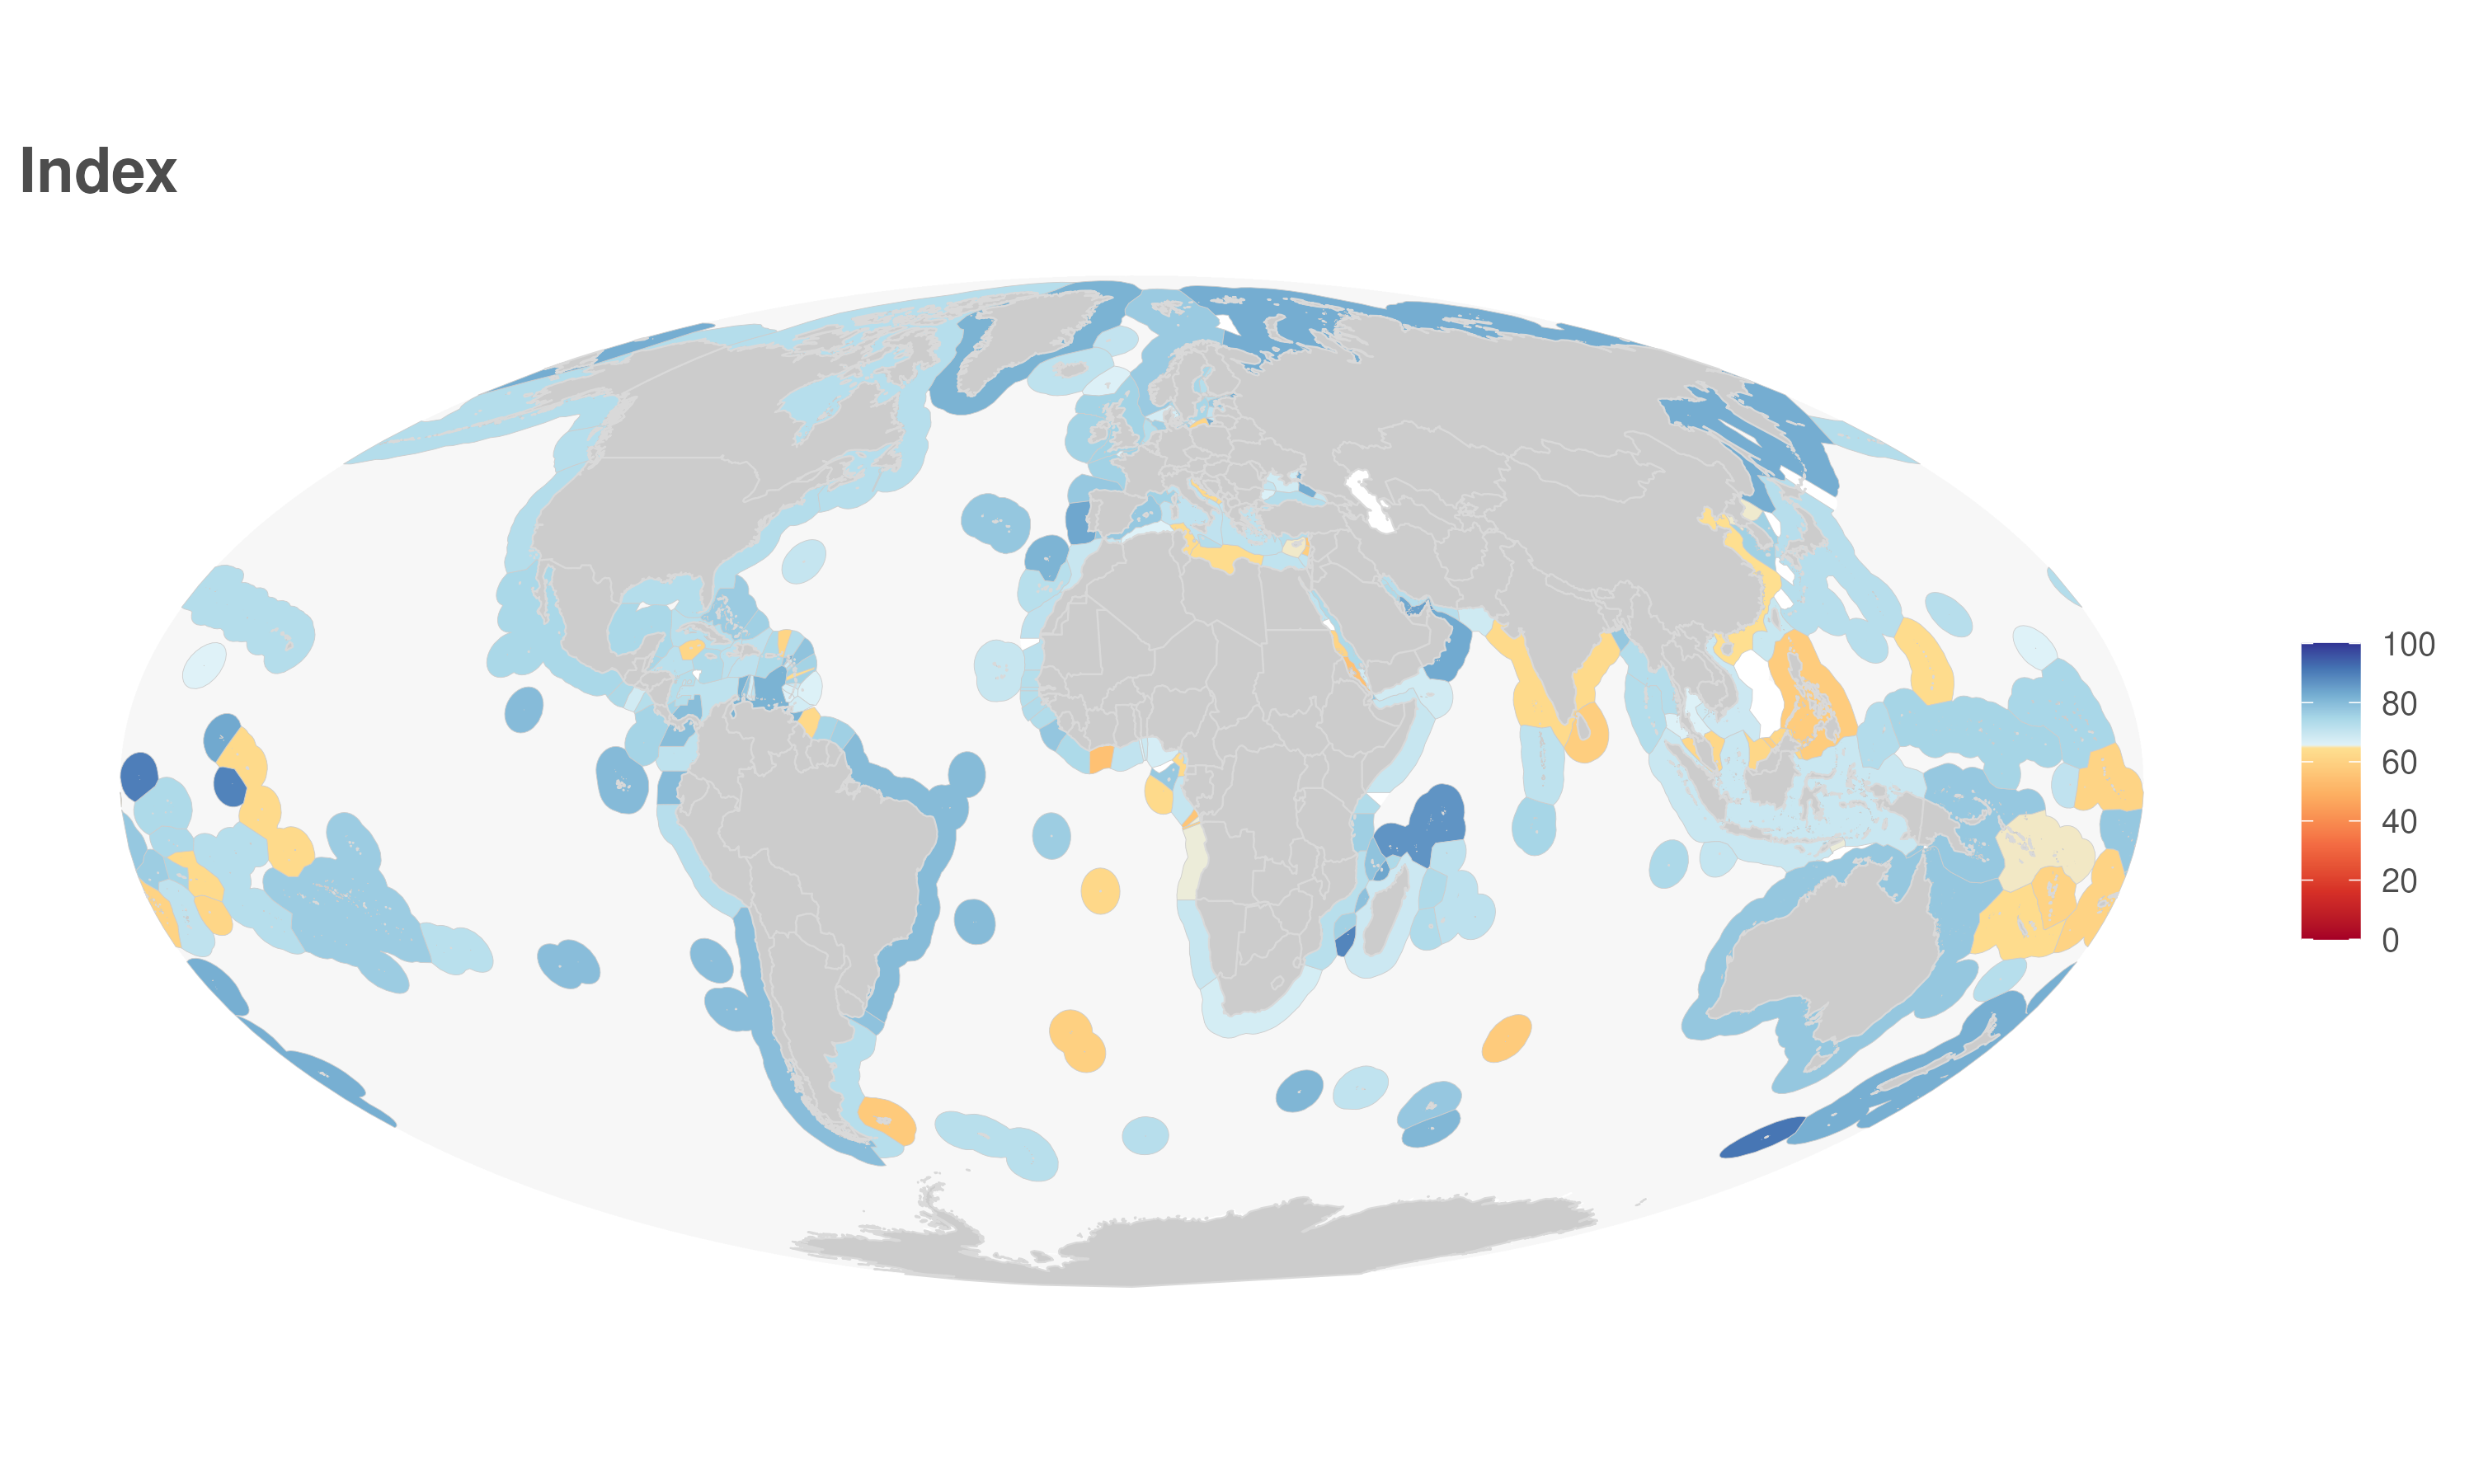
The overall global index score was 73 (Figure 1), which is similar to previous years. The regions with the highest scores tend to be uninhabited, or low human population, islands, although New Zealand, Portugal, Ecuador, Brazil, and the United Arab Emirates also have relatively high scores (Figure 2). Regions with lower scores tend to be in Africa, the Middle East, and parts of Asia.
Figure 1. Flower plot describing the average 2023 global Ocean Health scores (eez area weighted average of region scores) for the overall Index (center value) and goals/subgoals (petals).
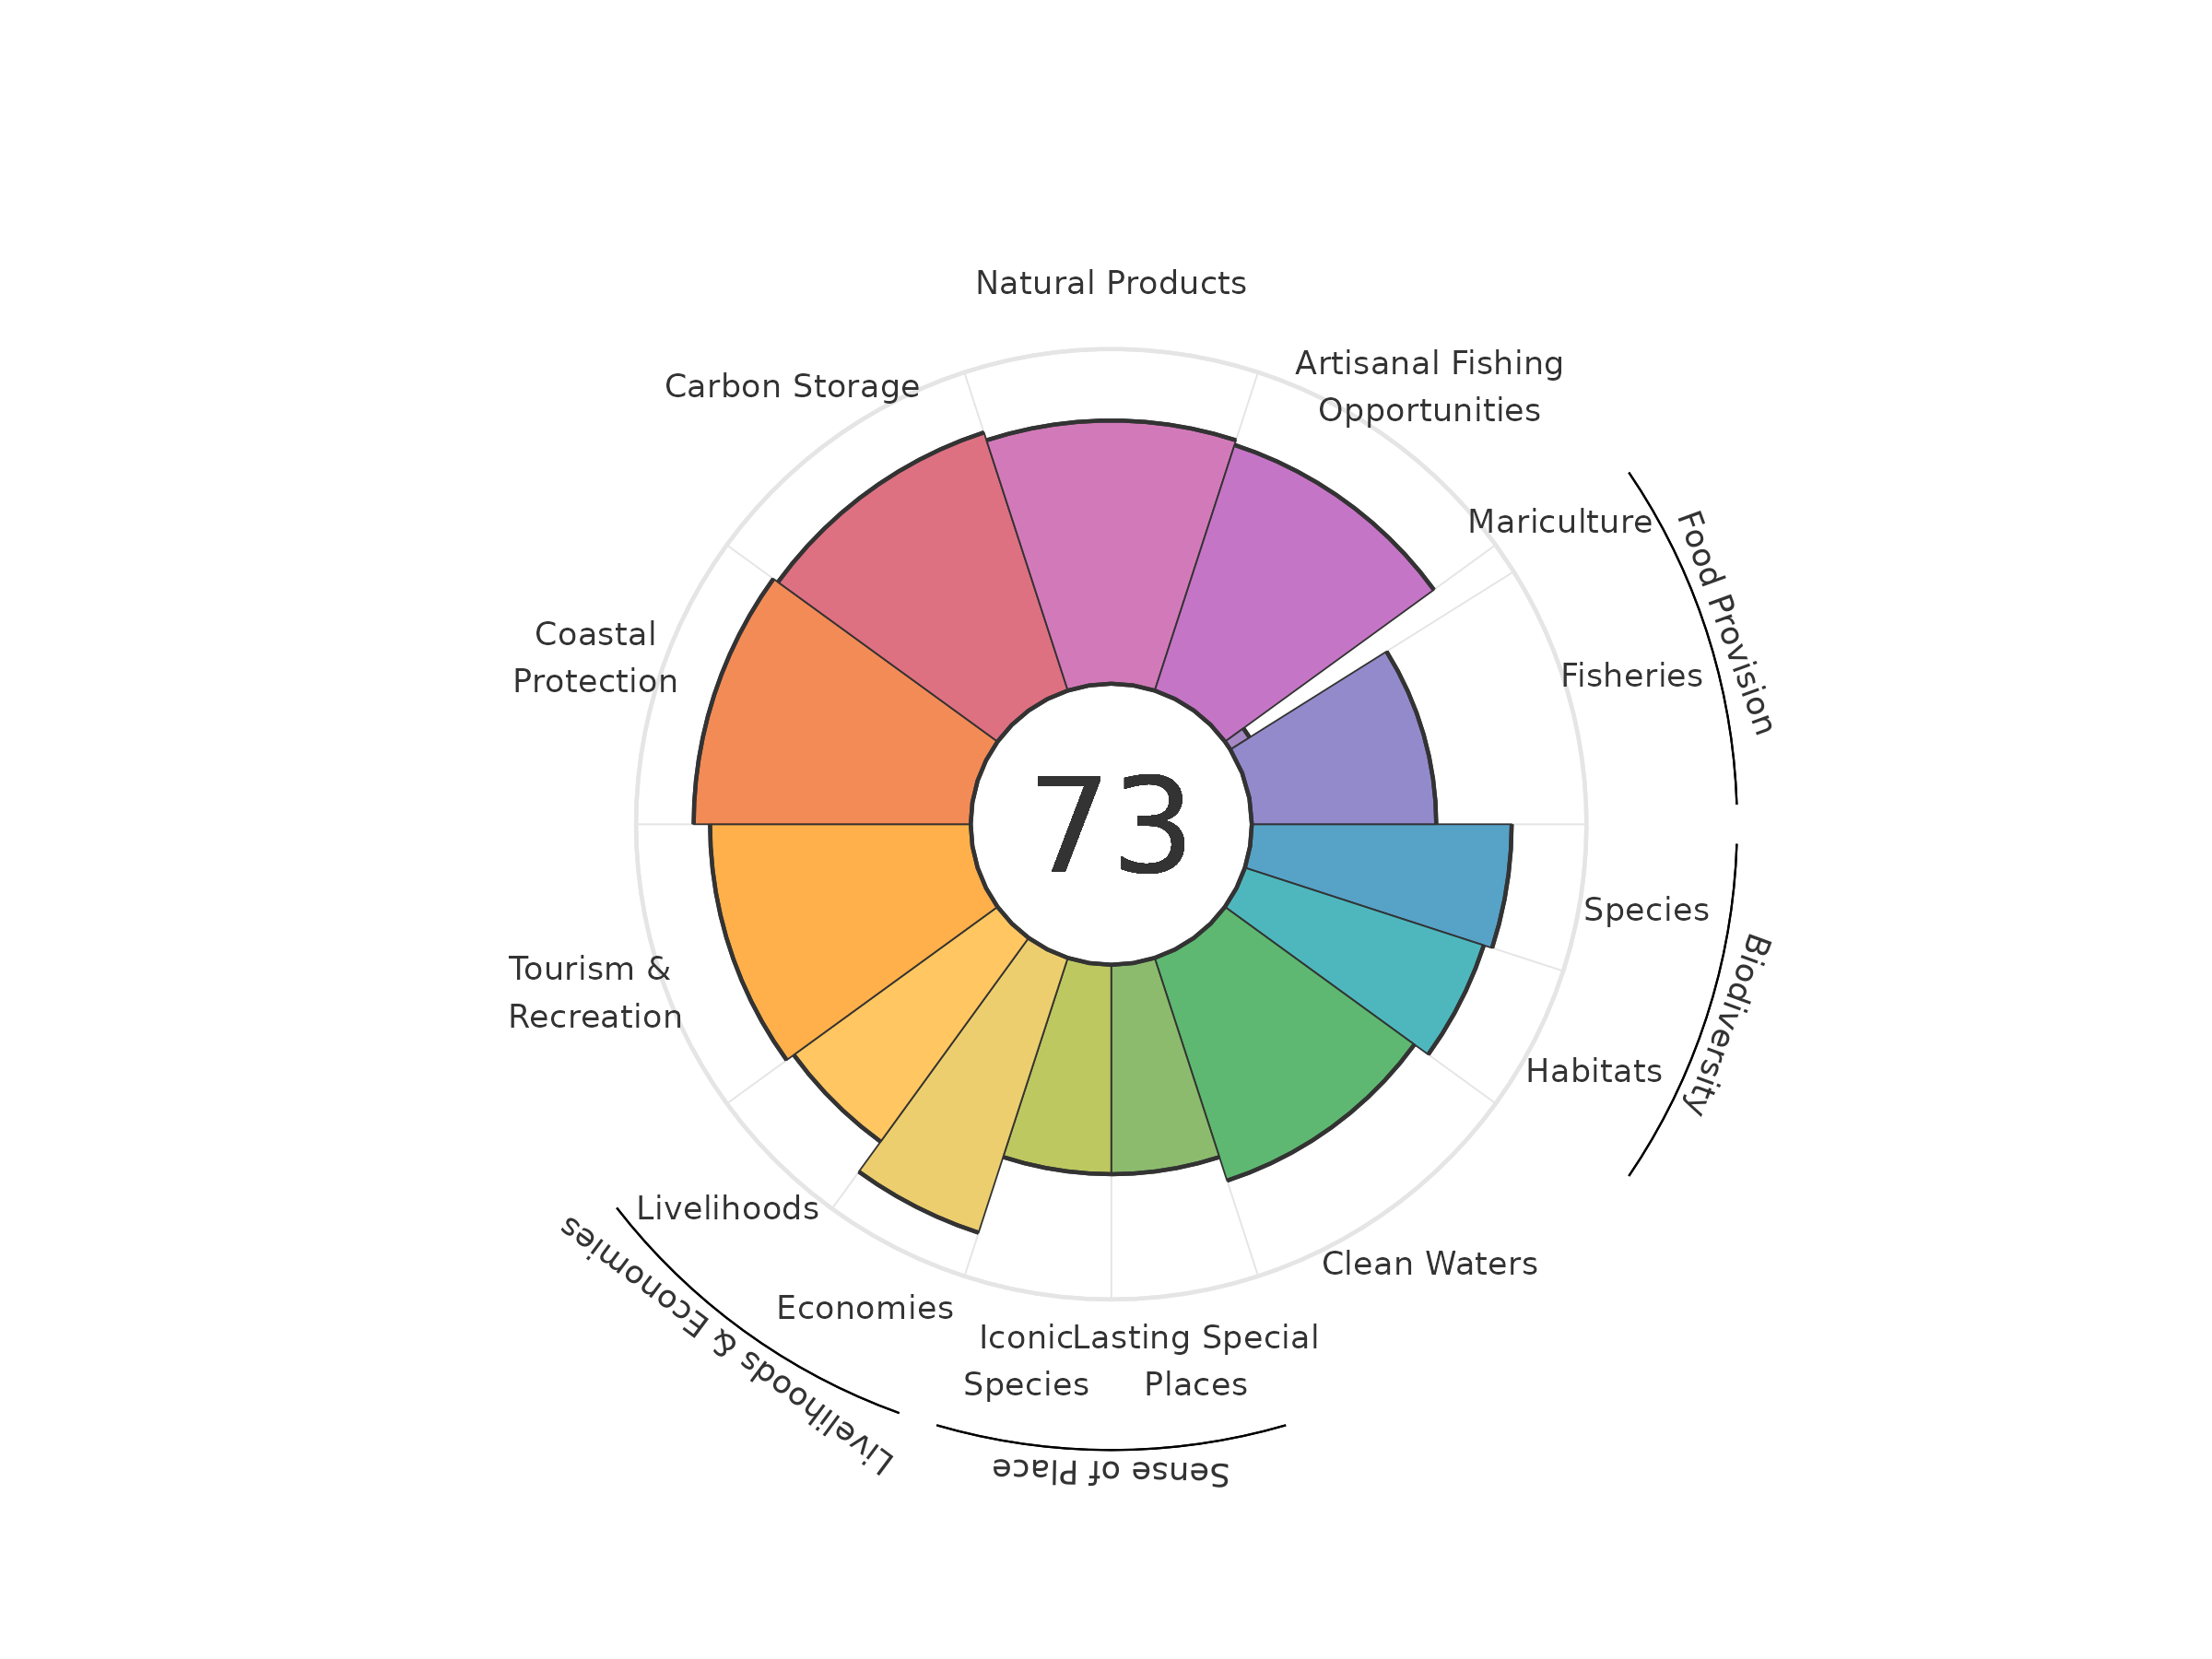
Figure 2. 2023 Ocean Health Index scores for 220 regions.
Although overall index scores have hovered around 73 since 2012, a deeper dive into the index reveals some interesting trends and patterns.
Scores for many regions are reasonably good, and global scores have increased since 2012 for some goals, such as: sense of place and clean waters. However, we observed some worrisome patterns for fisheries, iconic species, species condition, and tourism & recreation (due to the economic downturn of the COVID-19 pandemic).
Table 1. Ocean Health Index, global scores (eez area weighted average of region scores) for the Index and goals/subgoals for all years.
| goal | 2012 | 2013 | 2014 | 2015 | 2016 | 2017 | 2018 | 2019 | 2020 | 2021 | 2022 | 2023 | 2024 | |
|---|---|---|---|---|---|---|---|---|---|---|---|---|---|---|
| 1 | Index | 71.5 | 72.2 | 72.9 | 73.4 | 73.5 | 73.5 | 73.7 | 73.8 | 73.9 | 73.7 | 73.9 | 69 | 68.8 |
| 2 | Artisanal opportunities | 75 | 75.5 | 75.5 | 75.4 | 74.9 | 74.5 | 74.5 | 74.2 | 74.9 | 74.5 | 76.4 | 76.8 | 76.9 |
| 3 | Species condition (subgoal) | 79.9 | 79.9 | 79.7 | 79.4 | 79.2 | 78.9 | 78.7 | 78.5 | 78.2 | 78 | 77.7 | 77.5 | 77.2 |
| 4 | Biodiversity | 78.6 | 78.1 | 78.3 | 78.4 | 77.9 | 77.4 | 77.2 | 76.8 | 76.4 | 76.4 | 76.3 | 76.3 | 76.1 |
| 5 | Habitat (subgoal) | 77.4 | 76.3 | 76.8 | 77.4 | 76.6 | 75.9 | 75.8 | 75.2 | 74.7 | 74.8 | 74.9 | 75 | 74.9 |
| 6 | Coastal protection | 80.1 | 80.1 | 82.6 | 82.6 | 82.4 | 82.1 | 82 | 81.7 | 81.7 | 81.9 | 82.3 | 82.8 | 83 |
| 7 | Carbon storage | 81 | 81 | 81 | 81 | 81 | 81 | 81.1 | 81.1 | 81.1 | 81.1 | 81.1 | 81.1 | 81.1 |
| 8 | Clean water | 69.2 | 69 | 69.5 | 69.6 | 69.6 | 69.9 | 70.2 | 70.8 | 71 | 71.2 | 71.1 | 71.3 | 71.3 |
| 9 | Fisheries (subgoal) | 54.5 | 54.9 | 54.8 | 54.6 | 54.2 | 54 | 53.5 | 53.9 | 54.1 | 54.5 | 55.1 | 55 | 54.9 |
| 10 | Food provision | 50.7 | 51.1 | 51.1 | 50.7 | 50.4 | 50.1 | 49.5 | 49.7 | 49.6 | 49.7 | 50.1 | 50.1 | 50.1 |
| 11 | Mariculture (subgoal) | 5.7 | 5.7 | 5.7 | 5.7 | 5.8 | 5.9 | 6 | 6.1 | 6.2 | 6.4 | 6.6 | 6.8 | 6.9 |
| 12 | Iconic species (subgoal) | 66 | 66 | 66.8 | 66.9 | 67.6 | 67 | 67 | 67.7 | 65.3 | 63.3 | 62.9 | 62.8 | 62.8 |
| 13 | Sense of place | 60.4 | 61.1 | 61.4 | 61.9 | 62.4 | 62.6 | 63.5 | 64.4 | 63.6 | 62.8 | 62.6 | 62.4 | 62.4 |
| 14 | Lasting special places (subgoal) | 54.9 | 56.1 | 55.9 | 56.9 | 57.1 | 58.3 | 60.1 | 61.1 | 61.9 | 62.4 | 62.2 | 62 | 62 |
| 15 | Natural products | 75.2 | 75.7 | 76.5 | 76.7 | 76.6 | 76.3 | 75.8 | 74.1 | 74.3 | 72.8 | 73.4 | 73.7 | 74.3 |
| 16 | Tourism & recreation | 69 | 72.4 | 75.1 | 80.9 | 84.2 | 86.7 | 88.6 | 91.5 | 92.1 | 92.8 | 92.3 | 22.4 | 18.4 |
MORE RESULTS
Below we take a deeper dive into some of the interesting patterns we observed in the data for specific goals and regions.
Iconic Species
The iconic species subgoal, a component of sense of place, measures the conservation status of iconic species. The list of species used in this goal was originally created by combining WWF lists of priority and flagship species. This year we added additional culturally important species from Reyes-García et al., 2013 to broaden the scope of species covered. Of the new species added, the majority were listed as least concern by the IUCN Red List. Since we recalculate scores for all years every time new data is incorporated, this resulted in an increase for scores across all years as compared to last year’s calculations.
Despite the increase in iconic species scores overall, table 1 shows a decrease in the average score over time, with this year having the lowest calculated score. Changes in the iconic species score are largely driven by changes in IUCN conservation status, and are dependent on the species found in each OHI region. Since 2012, 12 of the iconic species decreased in the level to which they were threatened, while 15 species increased (IUCN, 2022). One such increase occurred for the grey reef shark, whose IUCN status changed from near threatened to endangered in 2020 (IUCN, 2022).
Protecting iconic species is critical for maintaining the connection people have with the ocean worldwide. Improvements in this goal depend on the success of conservation efforts for iconic species and their ecosystems. In order to preserve the important role these species play, it’s also critical to monitor additional holistic metrics of iconic species preservation, including biocultural status (Reyes-García et al., 2023).
Natural Products
Marine natural products can provide substantial economic benefits when sustainably harvested and traded. For example, millions of marine ornamental (aquarium) fish are harvested and exported for sale each year. This trade can provide a valuable and long-term income stream for low-income coastal communities if undertaken in a sustainable manner. This goal uses data from harvest and production of non-food seaweed, ornamental fish, and wild-caught fish used for fish oil and meal. A high score indicates that natural resources are maximally harvested at a rate that does not threaten future harvest and minimizes ecological harm.
The area weighted global natural products goal score has remained within a six point range for the last 12 years. Within recent years we have seen a higher level of volatility in global scores as the lowest and highest goal scores have been recorded in the last three years. We believe this was due to the COVID-19 pandemic’s impact on the industry and trade of natural products. Since the COVID shock the global score has rebounded and is now at its highest level on record.
Tourism and Recreation
The Tourism and Recreation goal aims to measure how well regions are sustainably providing access to coastal tourism and recreation activities and reflect how much people value and enjoy coastal spaces.
This year, the goal had a major overhaul. Originally, the goal used proportion of employment in tourism as one of its data layers. The original data source, the World Travel & Tourism Council (WTTC), is no longer freely accessible, so we switched data sources to the United Nations World Tourism Organization (UNWTO). The UNWTO’s dataset on employment in tourism had a large amount of missing data that was unable to be reasonably gapfilled at this time, so we transitioned to using one of their other datasets that provided total international arrivals. We specifically used data representing visitors who spent at least one overnight, gapfilling this with same-day visitors subtracted from total arrivals (UNWTO, n.d.). To make this a proportion, we divided by the total amount of international arrivals indicated in the dataset.
These methods changes generally resulted in increases for most regions across the years. Some regions that previously scored very well (e.g., Philippines), score poorly, while regions with large populations (China, USA), scored similarly under the old methods. With the new data, we still see the large decrease between 2019 and 2020, a result of the 2020 Covid-19 pandemic. Tourism and recreation scores are starting to recover from the Covid-19 pandemic, but we still do not see the pre-2020 levels yet. As new or updated global data sources become available or known, we hope to continue incorporating methods updates for this goal (e.g., including domestic tourism, including a metric for coastal arrivals, etc.).
References
-
IUCN. (2022). IUCN Red List Categories of Threatened Species (version 2022-2). http://www.iucnredlist.org/
-
Reyes-García, V., Cámara-Leret, R., Halpern, B. S., O’Hara, C., Renard, D., Zafra-Calvo, N., & Díaz, S. (2023). Biocultural vulnerability exposes threats of culturally important species. Proceedings of the National Academy of Sciences, 120(2), e2217303120. https://doi.org/10.1073/pnas.221730312
-
United Nations World Tourism Organization (UNWTO). (n.d.). Glossary of tourism terms. Retrieved September 14, 2023.